8: Convergence Diagnostics

Bayesian Mixed Effects Models with brms for Linguists

Author

Job Schepens

Published

January 6, 2026

1 The Problem: Can We Trust These Estimates?

1.1 Research Scenario

You’ve fitted a Bayesian model with brms. The code ran without errors. You got parameter estimates and credible intervals. But before you interpret or report these results, you need to ask:

“Did the MCMC sampler actually converge to the posterior distribution?”

If the chains haven’t converged, your estimates are unreliable — no matter how plausible they look!

1.2 Why Convergence Matters

MCMC (Markov Chain Monte Carlo) is a sampling algorithm that explores the posterior distribution. Think of it like:

  • Goal: Map out a mountain range (the posterior)
  • Method: Send out 4 hikers (chains) who wander randomly but tend toward high peaks
  • Success: After enough time, all hikers explore the same regions proportionally to altitude
  • Failure: Hikers get stuck in different valleys, never finding the true peaks

Convergence means all chains have “forgotten” their starting points and are sampling from the same distribution.

1.3 What Can Go Wrong?

1.3.1 Example Problems

  1. Chains haven’t mixed: Each chain explores a different part of parameter space
  2. Chains stuck in local modes: Model has multiple peaks, chains haven’t found the global one
  3. High autocorrelation: Chains move slowly, need many more iterations
  4. Insufficient information: Data too sparse, posterior poorly defined
  5. Model misspecification: Priors or likelihood don’t match the data structure

1.4 Preview: Our Diagnostic Tools

Today we’ll learn to check convergence using:

  1. Trace plots: Visual inspection of chain behavior over iterations
  2. R-hat statistic: Quantitative measure of between-chain vs within-chain variance
  3. Effective sample size (ESS): How many independent samples you really have
  4. Posterior predictive distributions: Do parameter values make substantive sense?
  5. Autocorrelation plots: How correlated are consecutive samples?
  6. Iteration doubling test: Does inference change with more samples?

2 Where We Are in the Analysis Workflow

2.1 The Bayesian Workflow So Far

Module 01-02: Build model + set priors
            ↓
Module 03: Check model fit (posterior predictive)
            ↓
Module 04: Test prior sensitivity
            ↓
Module 05: Compare models (LOO-CV for prediction)
            ↓
Module 06: Practical significance (ROPE, emmeans, marginaleffects)
            ↓
Module 07: Hypothesis comparison (Bayes Factors)
            ↓
Module 08 (TODAY): Convergence diagnostics
            ↓
         Report results!

2.2 When to Check Convergence?

Answer: ALWAYS, before interpreting any results!

Typical workflow:

  1. Fit model with default settings (4 chains, 2000 iterations)
  2. Check convergence diagnostics ← TODAY
  3. If problems detected:
    • Increase iterations
    • Adjust adapt_delta (for divergent transitions)
    • Reparameterize model
    • Check for coding errors or model misspecification
  4. Once converged → proceed to inference

3 The Five Essential Checks

3.1 Overview: What We’ll Check

For each model, we’ll ask:

  1. Trace plots: Do chains mix well and explore the same space?
  2. R-hat < 1.01: Are between-chain and within-chain variances similar?
  3. ESS > 400 (bulk and tail): Do we have enough effective samples?
  4. Low autocorrelation: Are consecutive samples reasonably independent?
  5. Substantive sense: Do parameter values match what we know about the phenomenon?

We’ll also test: 6. ✅ Stability test: Does doubling iterations change our conclusions?

Let’s work through these with real examples.

4 Setup and Data

4.1 Load Packages

Show code
library(brms)          # Bayesian regression models
library(tidyverse)     # Data manipulation
library(bayesplot)     # MCMC diagnostic plots
library(posterior)     # Working with posterior draws
library(tidybayes)     # Tidy MCMC tools
library(patchwork)     # Combining plots

# Set plotting theme
theme_set(theme_minimal(base_size = 14))

# Set seed for reproducibility
set.seed(42)

# Bayesplot options
color_scheme_set("viridis")

4.2 Simulate Reaction Time Data

We’ll use the same data structure as Modules 06 and 07: a psycholinguistic experiment with reaction times.

Show code
# Parameters
n_subjects <- 40
n_items <- 60
n_per_cell <- 3

# Generate data
rt_data <- expand_grid(
  subject = factor(1:n_subjects),
  item = factor(1:n_items),
  condition = factor(c("A", "B", "C"))
) %>%
  slice_sample(n = n_subjects * n_items * n_per_cell) %>%
  # Add random effects
  group_by(subject) %>%
  mutate(
    subj_intercept = rnorm(1, mean = 0, sd = 0.15),
    subj_slope_B = rnorm(1, mean = 0, sd = 0.08),
    subj_slope_C = rnorm(1, mean = 0, sd = 0.08)
  ) %>%
  group_by(item) %>%
  mutate(
    item_intercept = rnorm(1, mean = 0, sd = 0.10)
  ) %>%
  ungroup() %>%
  # Generate log-RT
  mutate(
    condition_effect_B = if_else(condition == "B", 0.12, 0),  # 12% slower
    condition_effect_C = if_else(condition == "C", 0.18, 0),  # 18% slower
    log_rt = 6.0 +  # baseline ≈ 400ms
             subj_intercept + 
             item_intercept + 
             condition_effect_B + 
             condition_effect_C +
             (condition == "B") * subj_slope_B +
             (condition == "C") * subj_slope_C +
             rnorm(n(), mean = 0, sd = 0.20),  # residual noise
    rt = exp(log_rt)
  ) %>%
  select(subject, item, condition, log_rt, rt)

# Data summary
cat("=== DATA SUMMARY ===\n")
=== DATA SUMMARY ===
Show code
rt_data %>%
  group_by(condition) %>%
  summarise(
    n = n(),
    mean_rt = mean(rt) %>% round(0),
    median_rt = median(rt) %>% round(0),
    sd_rt = sd(rt) %>% round(0),
    mean_log_rt = mean(log_rt) %>% round(3),
    .groups = "drop"
  ) %>%
  print()
# A tibble: 3 × 6
  condition     n mean_rt median_rt sd_rt mean_log_rt
  <fct>     <int>   <dbl>     <dbl> <dbl>       <dbl>
1 A          2400     414       400   117        5.99
2 B          2400     474       454   145        6.12
3 C          2400     509       480   154        6.19
Show code
cat("\nCondition B - A effect (log):", 
    round(mean(rt_data$log_rt[rt_data$condition == "B"]) - 
          mean(rt_data$log_rt[rt_data$condition == "A"]), 3), "\n")

Condition B - A effect (log): 0.13 
Show code
cat("Condition C - A effect (log):", 
    round(mean(rt_data$log_rt[rt_data$condition == "C"]) - 
          mean(rt_data$log_rt[rt_data$condition == "A"]), 3), "\n")
Condition C - A effect (log): 0.203 

4.3 Visualize the Data

Show code
p1 <- ggplot(rt_data, aes(x = condition, y = rt, fill = condition)) +
  geom_violin(alpha = 0.6) +
  geom_jitter(width = 0.2, alpha = 0.3, size = 0.5) +
  stat_summary(fun = mean, geom = "point", size = 3, color = "red") +
  stat_summary(fun.data = mean_cl_boot, geom = "errorbar", 
               width = 0.2, color = "red", linewidth = 1) +
  labs(title = "Reaction Times by Condition",
       y = "RT (ms)", x = "Condition") +
  theme(legend.position = "none")

p2 <- ggplot(rt_data, aes(x = condition, y = log_rt, fill = condition)) +
  geom_violin(alpha = 0.6) +
  geom_jitter(width = 0.2, alpha = 0.3, size = 0.5) +
  stat_summary(fun = mean, geom = "point", size = 3, color = "red") +
  stat_summary(fun.data = mean_cl_boot, geom = "errorbar",
               width = 0.2, color = "red", linewidth = 1) +
  labs(title = "Log-Transformed RTs",
       y = "log(RT)", x = "Condition") +
  theme(legend.position = "none")

p1 + p2

5 Check 1: Trace Plots

5.1 Fit a Well-Behaved Model

Let’s start with a model that should converge well.

Show code
# Define priors
rt_priors <- c(
  prior(normal(6, 1), class = Intercept),     # Baseline around 400ms
  prior(normal(0, 0.5), class = b),           # Effects typically < 50% change
  prior(exponential(1), class = sd),          # Moderate random effects
  prior(exponential(2), class = sigma),       # Residual noise
  prior(lkj(2), class = cor)                  # Slight correlation regularization
)

# Fit model with default settings
rt_model_good <- brm(
  log_rt ~ condition + (1 + condition | subject) + (1 | item),
  data = rt_data,
  family = gaussian(),
  prior = rt_priors,
  iter = 2000,
  warmup = 1000,
  chains = 4,
  cores = 4,
  seed = 42,
  backend = "cmdstanr",
  silent = 2,
  refresh = 0
)

5.2 Trace Plots: Visual Inspection

A trace plot shows parameter values across MCMC iterations for each chain.

Good trace plot (well-mixed chains): - All chains overlap completely - Look like “hairy caterpillars” - No trends or drift over time - Chains quickly forget their starting points

Bad trace plot (convergence problems): - Chains explore different regions - Systematic trends over time - One chain stuck while others move - Slow wandering (high autocorrelation)

Show code
# Extract posterior draws
posterior_good <- as_draws_array(rt_model_good)

# Plot traces for key parameters
mcmc_trace(
  posterior_good,
  pars = c("b_Intercept", "b_conditionB", "b_conditionC", 
           "sd_subject__Intercept", "sigma"),
  facet_args = list(ncol = 1)
) +
  labs(title = "Trace Plots: Well-Converged Model",
       subtitle = "All chains mix well and explore the same space")

What to Look For in Trace Plots

Good signs: - ✅ All 4 chains completely overlap - ✅ No systematic drift up or down - ✅ “Fuzzy caterpillar” appearance - ✅ Chains explore same range of values

Warning signs: - ❌ Chains separated vertically (exploring different modes) - ❌ Trends over time (non-stationarity) - ❌ One chain behaves differently - ❌ Slow, snake-like wandering

5.3 Trace Plot for All Parameters

Show code
# Get all parameter names (exclude lp__ and individual random effects)
all_pars <- variables(posterior_good)
focal_pars <- all_pars[!grepl("^r_|^lprior|^lp__|^prior_", all_pars)]

# Plot all focal parameters
mcmc_trace(posterior_good, pars = focal_pars) +
  labs(title = "Trace Plots: All Model Parameters")

5.4 Check Starting Points

Did chains “forget” their starting points quickly?

Show code
# Show first 100 iterations
mcmc_trace(
  posterior_good,
  pars = c("b_Intercept", "b_conditionB", "b_conditionC"),
  n_warmup = 100  # Show warmup period
) +
  labs(title = "First 100 Iterations (Warmup)",
       subtitle = "Chains should converge quickly from different starting points")

Warmup Period

The first warmup iterations (default 1000) are discarded. During warmup: - Stan tunes the sampler’s step size and mass matrix - Chains move from starting points toward the typical set - Once adapted, chains should sample from the stationary distribution

We only use post-warmup samples for inference.

6 Check 2: R-hat Statistic

6.1 What is R-hat?

R-hat (Gelman-Rubin statistic) compares: - Between-chain variance: How different are the chain means? - Within-chain variance: How much do values vary within each chain?

Formula (simplified): R̂ = sqrt(between-chain variance / within-chain variance)

Interpretation: - R̂ = 1.00: Perfect convergence, chains identical - R̂ < 1.01: Acceptable (modern threshold, stricter than old 1.1) - R̂ > 1.01: Chains haven’t converged, don’t trust estimates!

6.2 Check R-hat for Our Model

Show code
# Get R-hat for all parameters
rhat_vals <- rhat(rt_model_good)

cat("=== R-HAT SUMMARY ===\n")
=== R-HAT SUMMARY ===
Show code
cat("Total parameters:", length(rhat_vals), "\n")
Total parameters: 194 
Show code
cat("Max R-hat:", round(max(rhat_vals, na.rm = TRUE), 4), "\n")
Max R-hat: 1.0302 
Show code
cat("Parameters with R-hat > 1.01:", sum(rhat_vals > 1.01, na.rm = TRUE), "\n\n")
Parameters with R-hat > 1.01: 42 
Show code
# Show parameters with highest R-hat
cat("Top 10 R-hat values:\n")
Top 10 R-hat values:
Show code
sort(rhat_vals, decreasing = TRUE)[1:10] %>% round(4) %>% print()
            b_Intercept               Intercept  r_subject[2,Intercept] 
                 1.0302                  1.0286                  1.0216 
r_subject[40,Intercept] r_subject[11,Intercept]  r_subject[4,Intercept] 
                 1.0202                  1.0197                  1.0183 
r_subject[26,Intercept] r_subject[24,Intercept] r_subject[12,Intercept] 
                 1.0181                  1.0179                  1.0179 
 r_subject[3,Intercept] 
                 1.0173 

6.3 Visual R-hat Diagnostic

Show code
# Plot R-hat for all parameters
mcmc_rhat(rhat_vals) +
  labs(title = "R-hat Distribution",
       subtitle = "All values should be < 1.01") +
  geom_vline(xintercept = 1.01, linetype = "dashed", color = "red") +
  annotate("text", x = 1.01, y = Inf, label = "Threshold", 
           vjust = 1.5, color = "red")

R-hat Decision Rules
  • R̂ < 1.01 for all parameters: ✅ Chains converged, proceed with inference
  • R̂ > 1.01 for any parameter: ❌ Convergence failure!
    • Increase iterations (iter = 4000 or more)
    • Check for model misspecification
    • Inspect trace plots for the problematic parameters
    • Consider reparameterizing the model

7 Check 3: Effective Sample Size (ESS)

7.1 What is ESS?

MCMC samples are autocorrelated — consecutive samples are similar. This means: - You have 4000 total samples (4 chains × 1000 post-warmup) - But they don’t contain as much information as 4000 independent samples - Effective sample size (ESS) estimates the equivalent number of independent samples

Two types: 1. ESS Bulk: For the central 80% of the distribution (for means, medians) 2. ESS Tail: For the extreme 5% tails (for quantiles, credible intervals)

Rule of thumb: - ESS > 400 (both bulk and tail): Reliable estimates - ESS < 400: Increase iterations or check for convergence problems

7.2 Check ESS for Our Model

Show code
# Get ESS values
ess_bulk_vals <- ess_bulk(rt_model_good)
ess_tail_vals <- ess_tail(rt_model_good)

cat("=== ESS BULK SUMMARY ===\n")
=== ESS BULK SUMMARY ===
Show code
cat("Min ESS Bulk:", round(min(ess_bulk_vals, na.rm = TRUE), 0), "\n")
Min ESS Bulk: 213 
Show code
cat("Median ESS Bulk:", round(median(ess_bulk_vals, na.rm = TRUE), 0), "\n")
Median ESS Bulk: 213 
Show code
cat("Parameters with ESS Bulk < 400:", sum(ess_bulk_vals < 400, na.rm = TRUE), "\n\n")
Parameters with ESS Bulk < 400: 1 
Show code
cat("=== ESS TAIL SUMMARY ===\n")
=== ESS TAIL SUMMARY ===
Show code
cat("Min ESS Tail:", round(min(ess_tail_vals, na.rm = TRUE), 0), "\n")
Min ESS Tail: Inf 
Show code
cat("Median ESS Tail:", round(median(ess_tail_vals, na.rm = TRUE), 0), "\n")
Median ESS Tail: NA 
Show code
cat("Parameters with ESS Tail < 400:", sum(ess_tail_vals < 400, na.rm = TRUE), "\n\n")
Parameters with ESS Tail < 400: 0 
Show code
# Show parameters with lowest ESS
cat("Bottom 10 ESS Bulk values:\n")
Bottom 10 ESS Bulk values:
Show code
sort(ess_bulk_vals)[1:10] %>% round(0) %>% print()
 [1] 213  NA  NA  NA  NA  NA  NA  NA  NA  NA

7.3 Visual ESS Diagnostic

Show code
# Plot ESS distributions with zoomed y-axis for better visibility
p1 <- mcmc_neff(ess_bulk_vals) +
  labs(title = "ESS Bulk Distribution",
       subtitle = "Should be > 400 for reliable central estimates",
       y = "Effective Sample Size (Bulk)") +
  geom_vline(xintercept = 400, linetype = "dashed", color = "red", linewidth = 1) +
  coord_cartesian(ylim = c(0, max(1500, max(ess_bulk_vals, na.rm = TRUE) * 1.1))) +
  theme_minimal()

p2 <- mcmc_neff(ess_tail_vals) +
  labs(title = "ESS Tail Distribution",
       subtitle = "Should be > 400 for reliable interval estimates",
       y = "Effective Sample Size (Tail)") +
  geom_vline(xintercept = 400, linetype = "dashed", color = "red", linewidth = 1) +
  coord_cartesian(ylim = c(0, max(1500, max(ess_tail_vals, na.rm = TRUE) * 1.1))) +
  theme_minimal()

p1 + p2

7.4 ESS as Proportion of Total Samples

Show code
# Calculate ESS ratio (ESS / total post-warmup samples)
total_samples <- 4000  # 4 chains × 1000 post-warmup iterations
ess_ratio_bulk <- ess_bulk_vals / total_samples
ess_ratio_tail <- ess_tail_vals / total_samples

cat("ESS Ratio (ESS / 4000 samples):\n")
ESS Ratio (ESS / 4000 samples):
Show code
cat("  Median Bulk:", round(median(ess_ratio_bulk, na.rm = TRUE), 2), "\n")
  Median Bulk: 0.05 
Show code
cat("  Median Tail:", round(median(ess_ratio_tail, na.rm = TRUE), 2), "\n\n")
  Median Tail: NA 
Show code
cat("Interpretation:\n")
Interpretation:
Show code
cat("  Ratio = 1.0: No autocorrelation (every sample independent)\n")
  Ratio = 1.0: No autocorrelation (every sample independent)
Show code
cat("  Ratio = 0.5: Half as much info as independent samples\n")
  Ratio = 0.5: Half as much info as independent samples
Show code
cat("  Ratio = 0.1: Highly autocorrelated, need 10× more iterations\n")
  Ratio = 0.1: Highly autocorrelated, need 10× more iterations
ESS Decision Rules

For each parameter: - ESS Bulk > 400 AND ESS Tail > 400: ✅ Sufficient samples - ESS < 400: ❌ Increase iterations - If ESS ≈ 200: Double iterations (iter = 4000) - If ESS < 100: Quadruple iterations or investigate model issues

Quick fix: Increase iterations proportionally to achieve ESS > 400:

new_iter = current_iter * (400 / min_ess)

8 Check 4: Autocorrelation

8.1 What is Autocorrelation?

Autocorrelation measures how similar consecutive MCMC samples are.

  • Lag 1 autocorrelation: Correlation between sample \(t\) and sample \(t+1\)
  • Lag k autocorrelation: Correlation between sample \(t\) and sample \(t+k\)

Why it matters: - High autocorrelation → samples contain redundant information - Low autocorrelation → chains explore efficiently - Affects ESS: higher autocorrelation → lower ESS

What we want: - Autocorrelation drops to near 0 by lag 10-20 - If still high at lag 50+: chains are mixing poorly

8.2 Autocorrelation Plots

Show code
# Plot autocorrelation for key parameters
mcmc_acf(
  posterior_good,
  pars = c("b_Intercept", "b_conditionB", "b_conditionC",
           "sd_subject__Intercept", "sigma"),
  lags = 40
) +
  labs(title = "Autocorrelation Plots",
       subtitle = "Should drop to near 0 by lag 10-20")

Interpreting ACF Plots

Good (low autocorrelation): - ✅ Drops below 0.1 by lag 5-10 - ✅ Fluctuates around 0 for higher lags - ✅ No systematic patterns

Problematic (high autocorrelation): - ❌ Stays above 0.3 beyond lag 20 - ❌ Slow exponential decay - ❌ ESS will be low

Solutions: - Increase iterations (more samples compensate for correlation) - Thin chains (keep every k-th sample, though less efficient than more iterations) - Reparameterize model (e.g., center predictors)

8.3 Autocorrelation by Chain

Show code
# Check if autocorrelation differs across chains
mcmc_acf_bar(
  posterior_good,
  pars = c("b_Intercept", "b_conditionB", "b_conditionC"),
  lags = 20
) +
  labs(title = "Autocorrelation by Chain",
       subtitle = "Should be similar across all chains")

9 Check 5: Substantive Sense

9.1 Do Parameter Values Make Sense?

Beyond statistical convergence, parameters should make substantive sense based on:

  1. Domain knowledge: Do values align with what we know about the phenomenon?
  2. Scale expectations: Are effects plausible given measurement scale?
  3. Sign expectations: Are effects in the expected direction?
  4. Relative magnitudes: Are effect sizes reasonable compared to variability?

9.2 Examine Posterior Distributions

Show code
# Extract fixed effects
fixef_draws <- as_draws_df(rt_model_good) %>%
  select(starts_with("b_")) %>%
  pivot_longer(everything(), names_to = "parameter", values_to = "value")

# Plot posterior distributions
ggplot(fixef_draws, aes(x = value, fill = parameter)) +
  geom_density(alpha = 0.6) +
  facet_wrap(~ parameter, scales = "free", ncol = 1) +
  geom_vline(xintercept = 0, linetype = "dashed") +
  labs(title = "Posterior Distributions: Fixed Effects",
       x = "Parameter Value", y = "Density") +
  theme(legend.position = "none")

9.3 Interpret Fixed Effects

Show code
# Get summary statistics
fixef_summary <- fixef(rt_model_good)
print(fixef_summary)
            Estimate  Est.Error       Q2.5     Q97.5
Intercept  5.9870814 0.03338817 5.91997791 6.0514296
conditionB 0.1291542 0.01548296 0.09987102 0.1607197
conditionC 0.2019316 0.01435443 0.17409168 0.2305139
Show code
cat("\n=== SUBSTANTIVE INTERPRETATION ===\n\n")

=== SUBSTANTIVE INTERPRETATION ===
Show code
cat("1. Intercept (Condition A baseline):\n")
1. Intercept (Condition A baseline):
Show code
cat("   Estimate:", round(fixef_summary["Intercept", "Estimate"], 3), 
    "log-ms → exp(", round(fixef_summary["Intercept", "Estimate"], 2), 
    ") ≈", round(exp(fixef_summary["Intercept", "Estimate"]), 0), "ms\n")
   Estimate: 5.987 log-ms → exp( 5.99 ) ≈ 398 ms
Show code
cat("   ✓ Reasonable RT for linguistic stimuli (300-600ms typical)\n\n")
   ✓ Reasonable RT for linguistic stimuli (300-600ms typical)
Show code
cat("2. Condition B effect:\n")
2. Condition B effect:
Show code
cat("   Estimate:", round(fixef_summary["conditionB", "Estimate"], 3), "log units\n")
   Estimate: 0.129 log units
Show code
cat("   → ", round((exp(fixef_summary["conditionB", "Estimate"]) - 1) * 100, 1), 
    "% change in RT\n")
   →  13.8 % change in RT
Show code
cat("   ✓ Moderate effect, typical for experimental manipulations\n\n")
   ✓ Moderate effect, typical for experimental manipulations
Show code
cat("3. Condition C effect:\n")
3. Condition C effect:
Show code
cat("   Estimate:", round(fixef_summary["conditionC", "Estimate"], 3), "log units\n")
   Estimate: 0.202 log units
Show code
cat("   → ", round((exp(fixef_summary["conditionC", "Estimate"]) - 1) * 100, 1), 
    "% change in RT\n")
   →  22.4 % change in RT
Show code
cat("   ✓ Larger than B, consistent with hypothesized ordering\n\n")
   ✓ Larger than B, consistent with hypothesized ordering

9.4 Examine Random Effects Variability

Show code
# Extract random effects SDs
re_draws <- as_draws_df(rt_model_good) %>%
  select(starts_with("sd_")) %>%
  pivot_longer(everything(), names_to = "parameter", values_to = "value")

# Plot
ggplot(re_draws, aes(x = value, fill = parameter)) +
  geom_density(alpha = 0.6) +
  facet_wrap(~ parameter, scales = "free", ncol = 2) +
  labs(title = "Posterior Distributions: Random Effects SDs",
       x = "Standard Deviation", y = "Density") +
  theme(legend.position = "none")

Show code
# Get random effects summary and format nicely
cat("\n=== RANDOM EFFECTS VARIABILITY ===\n\n")

=== RANDOM EFFECTS VARIABILITY ===
Show code
ranef_summary <- VarCorr(rt_model_good)

# Print the raw summary first for reference
print(ranef_summary)
$item
$item$sd
           Estimate  Est.Error       Q2.5     Q97.5
Intercept 0.1086299 0.01079036 0.09043753 0.1323893


$subject
$subject$sd
             Estimate  Est.Error       Q2.5     Q97.5
Intercept  0.17862168 0.02246552 0.14231358 0.2294753
conditionB 0.08987458 0.01269141 0.06861088 0.1177892
conditionC 0.08242443 0.01185874 0.06259936 0.1091452

$subject$cor
, , Intercept

             Estimate Est.Error       Q2.5     Q97.5
Intercept  1.00000000 0.0000000  1.0000000 1.0000000
conditionB 0.06041412 0.1655031 -0.2805700 0.3747177
conditionC 0.10294729 0.1661161 -0.2213175 0.4220262

, , conditionB

              Estimate Est.Error      Q2.5     Q97.5
Intercept   0.06041412 0.1655031 -0.280570 0.3747177
conditionB  1.00000000 0.0000000  1.000000 1.0000000
conditionC -0.08781520 0.1815400 -0.441408 0.2595498

, , conditionC

             Estimate Est.Error       Q2.5     Q97.5
Intercept   0.1029473 0.1661161 -0.2213175 0.4220262
conditionB -0.0878152 0.1815400 -0.4414080 0.2595498
conditionC  1.0000000 0.0000000  1.0000000 1.0000000


$subject$cov
, , Intercept

               Estimate   Est.Error         Q2.5       Q97.5
Intercept  0.0324102780 0.008416199  0.020253155 0.052658915
conditionB 0.0009210763 0.002855242 -0.005079781 0.006526851
conditionC 0.0014989473 0.002631428 -0.003461325 0.006965401

, , conditionB

                Estimate   Est.Error         Q2.5       Q97.5
Intercept   0.0009210763 0.002855242 -0.005079781 0.006526851
conditionB  0.0082384725 0.002380799  0.004707453 0.013874286
conditionC -0.0006100925 0.001427285 -0.003496026 0.002183864

, , conditionC

                Estimate   Est.Error         Q2.5       Q97.5
Intercept   0.0014989473 0.002631428 -0.003461325 0.006965401
conditionB -0.0006100925 0.001427285 -0.003496026 0.002183864
conditionC  0.0069343818 0.002044330  0.003918680 0.011912665


$residual__
$residual__$sd
  Estimate   Est.Error      Q2.5    Q97.5
 0.2010077 0.001683724 0.1977314 0.204301
Show code
# Extract variance components into a readable table
library(tibble)
library(knitr)

# Get posterior draws to calculate proper credible intervals
draws_df <- as_draws_df(rt_model_good)

# Calculate summaries from posterior draws
variance_stats <- tibble(
  Component = c(
    "Subject: Intercept SD",
    "Subject: Condition slope SD", 
    "Item: Intercept SD",
    "Residual SD"
  ),
  Estimate = c(
    sprintf("%.3f", mean(draws_df$sd_subject__Intercept)),
    sprintf("%.3f", mean(draws_df$`sd_subject__conditionB:conditionA`)),
    sprintf("%.3f", mean(draws_df$sd_item__Intercept)),
    sprintf("%.3f", mean(draws_df$sigma))
  ),
  `95% CI Lower` = c(
    sprintf("%.3f", quantile(draws_df$sd_subject__Intercept, 0.025)),
    sprintf("%.3f", quantile(draws_df$`sd_subject__conditionB:conditionA`, 0.025)),
    sprintf("%.3f", quantile(draws_df$sd_item__Intercept, 0.025)),
    sprintf("%.3f", quantile(draws_df$sigma, 0.025))
  ),
  `95% CI Upper` = c(
    sprintf("%.3f", quantile(draws_df$sd_subject__Intercept, 0.975)),
    sprintf("%.3f", quantile(draws_df$`sd_subject__conditionB:conditionA`, 0.975)),
    sprintf("%.3f", quantile(draws_df$sd_item__Intercept, 0.975)),
    sprintf("%.3f", quantile(draws_df$sigma, 0.975))
  ),
  Interpretation = c(
    "Between-subject variation in baseline RT",
    "Between-subject variation in condition effect",
    "Between-item variation in difficulty",
    "Within-subject/item unexplained variation"
  )
)

kable(variance_stats, caption = "Random Effects Variance Components")
Random Effects Variance Components
Component Estimate 95% CI Lower 95% CI Upper Interpretation
Subject: Intercept SD 0.179 0.142 0.229 Between-subject variation in baseline RT
Subject: Condition slope SD NA NA NA Between-subject variation in condition effect
Item: Intercept SD 0.109 0.090 0.132 Between-item variation in difficulty
Residual SD 0.201 0.198 0.204 Within-subject/item unexplained variation
Show code
cat("\n✓ All SDs are positive and substantively reasonable\n")

✓ All SDs are positive and substantively reasonable
Show code
# Check for correlation if it exists in the model
if ("cor_subject__Intercept__conditionB:conditionA" %in% names(draws_df)) {
  cor_mean <- mean(draws_df$`cor_subject__Intercept__conditionB:conditionA`)
  cat(sprintf("✓ Subject intercept-slope correlation: %.3f ", cor_mean))
  cat(ifelse(abs(cor_mean) > 0.3, "(moderate)", "(weak)"), "\n")
}
Substantive Sense Checklist

For your domain (psycholinguistics, phonetics, etc.), ask:

  1. Scale: Are values in the right ballpark?
    • RTs: 200-2000ms typical
    • Log-RTs: ~5.3-7.6 (exp scale)
    • Accuracy: 0-1 (binomial), logit scale ≈ -5 to +5
  2. Sign: Are effects in the expected direction?
    • More difficult → slower/less accurate
    • Priming → faster RTs
  3. Magnitude: Are effects plausible?
    • Strong manipulations: 10-30% RT change
    • Subtle effects: 2-10% change
    • Random effects: Usually smaller than residual SD
  4. Relative sizes: Do comparisons make sense?
    • Fixed effect < random effect variation → individual differences dominate
    • SD(items) << SD(subjects) → consistent across items

If estimates seem unreasonable, check: - Model specification (wrong family, missing predictors) - Priors (too strong, pulling estimates away from data) - Data coding errors (e.g., RT in seconds instead of milliseconds)

10 Check 6: Doubling Iterations Test

10.1 Why Double Iterations?

If chains have truly converged: - Doubling iterations should give nearly identical parameter estimates - Credible intervals should have similar widths - Conclusions shouldn’t change

If estimates change substantially: - Original model hadn’t fully converged - Need even more iterations

10.2 Fit Model with Doubled Iterations

Show code
# Fit same model with 2× iterations
rt_model_doubled <- brm(
  log_rt ~ condition + (1 + condition | subject) + (1 | item),
  data = rt_data,
  family = gaussian(),
  prior = rt_priors,
  iter = 4000,      # Doubled from 2000
  warmup = 2000,    # Doubled from 1000
  chains = 4,
  cores = 4,
  seed = 42,
  backend = "cmdstanr",
  silent = 2,
  refresh = 0
)

10.3 Compare Parameter Estimates

Show code
# Extract fixed effects from both models
fixef_original <- fixef(rt_model_good)
fixef_doubled <- fixef(rt_model_doubled)

# Compare
comparison <- data.frame(
  Parameter = rownames(fixef_original),
  Original_Est = fixef_original[, "Estimate"],
  Doubled_Est = fixef_doubled[, "Estimate"],
  Original_SE = fixef_original[, "Est.Error"],
  Doubled_SE = fixef_doubled[, "Est.Error"]
) %>%
  mutate(
    Est_Diff = Doubled_Est - Original_Est,
    Est_Diff_Pct = abs(Est_Diff / Original_Est) * 100,
    SE_Ratio = Doubled_SE / Original_SE
  )

print(comparison)
            Parameter Original_Est Doubled_Est Original_SE Doubled_SE
Intercept   Intercept    5.9870814   5.9862924  0.03338817 0.03178091
conditionB conditionB    0.1291542   0.1292009  0.01548296 0.01554502
conditionC conditionC    0.2019316   0.2026220  0.01435443 0.01423280
                Est_Diff Est_Diff_Pct  SE_Ratio
Intercept  -7.889914e-04   0.01317823 0.9518614
conditionB  4.665406e-05   0.03612275 1.0040083
conditionC  6.904251e-04   0.34191032 0.9915269
Show code
cat("\n=== STABILITY ASSESSMENT ===\n")

=== STABILITY ASSESSMENT ===
Show code
cat("Max absolute difference in estimates:", 
    round(max(abs(comparison$Est_Diff)), 4), "\n")
Max absolute difference in estimates: 8e-04 
Show code
cat("Max percentage change:", 
    round(max(comparison$Est_Diff_Pct), 2), "%\n")
Max percentage change: 0.34 %
Show code
cat("Median SE ratio (should be ~0.7 for 2× samples):", 
    round(median(comparison$SE_Ratio), 2), "\n")
Median SE ratio (should be ~0.7 for 2× samples): 0.99 

10.4 Visual Comparison

Show code
# Prepare data for plotting
plot_data <- comparison %>%
  select(Parameter, Original_Est, Doubled_Est) %>%
  pivot_longer(cols = c(Original_Est, Doubled_Est),
               names_to = "Iterations", values_to = "Estimate") %>%
  mutate(Iterations = recode(Iterations, 
                        Original_Est = "Original (2000)",
                        Doubled_Est = "Doubled (4000)"))

# Plot comparison
ggplot(plot_data, aes(x = Parameter, y = Estimate, color = Iterations)) +
  geom_point(size = 3, position = position_dodge(width = 0.4)) +
  geom_line(aes(group = Parameter), color = "gray50", alpha = 0.5) +
  geom_hline(yintercept = 0, linetype = "dashed") +
  labs(title = "Parameter Estimates: Original vs Doubled Iterations",
       subtitle = "Estimates are nearly identical - indicating good convergence",
       x = NULL, y = "Estimate") +
  theme_minimal() +
  theme(axis.text.x = element_text(angle = 45, hjust = 1),
        legend.position = "top")

10.5 Compare Credible Intervals

Show code
# Extract full credible intervals
ci_original <- as.data.frame(fixef_original) %>%
  rownames_to_column("Parameter") %>%
  mutate(Iterations = "Original (2000)")

ci_doubled <- as.data.frame(fixef_doubled) %>%
  rownames_to_column("Parameter") %>%
  mutate(Iterations = "Doubled (4000)")

ci_both <- bind_rows(ci_original, ci_doubled)

# Plot
ggplot(ci_both, aes(x = Parameter, y = Estimate, color = Iterations)) +
  geom_pointrange(aes(ymin = Q2.5, ymax = Q97.5),
                  position = position_dodge(width = 0.5),
                  size = 0.8, linewidth = 1) +
  geom_hline(yintercept = 0, linetype = "dashed") +
  labs(title = "95% Credible Intervals: Original vs Doubled Iterations",
       subtitle = "Credible intervals overlap almost completely - good convergence",
       x = NULL, y = "Estimate (with 95% CI)") +
  theme_minimal() +
  theme(axis.text.x = element_text(angle = 45, hjust = 1),
        legend.position = "top")

Iteration Doubling Decision Rules

If parameter estimates change by: - < 1%: ✅ Excellent stability, original iterations sufficient - 1-5%: ✅ Acceptable, convergence achieved - 5-10%: ⚠️ Marginal, consider using doubled model - > 10%: ❌ Not converged, use even more iterations or investigate

Standard error ratio (SE_doubled / SE_original): - Expected: ~0.71 (= 1/√2, from doubling sample size) - Actual < 0.71: Even better precision than expected - Actual > 0.71: Less efficient sampling (high autocorrelation)

11 Example: Poorly Converged Model

11.1 Create a Convergence Problem

Let’s deliberately create a model with convergence issues by using: - Very small sample size (insufficient data) - Weak priors (letting model wander) - Complex random effects structure (many parameters to estimate)

Show code
# Create very small dataset
rt_data_small <- rt_data %>%
  filter(subject %in% 1:8) %>%  # Only 8 subjects
  filter(item %in% 1:10)         # Only 10 items

cat("Small dataset: n =", nrow(rt_data_small), "\n")
Small dataset: n = 240 
Show code
cat("Subjects:", n_distinct(rt_data_small$subject), "\n")
Subjects: 8 
Show code
cat("Items:", n_distinct(rt_data_small$item), "\n")
Items: 10 
Show code
# Very weak priors
weak_priors <- c(
  prior(normal(6, 10), class = Intercept),    # Very vague
  prior(normal(0, 10), class = b),            # Very vague
  prior(exponential(0.1), class = sd),        # Allows huge variance
  prior(exponential(0.1), class = sigma),
  prior(lkj(1), class = cor)                  # Uniform (uninformative)
)

# Fit model with insufficient data
rt_model_bad <- brm(
  log_rt ~ condition + (1 + condition | subject) + (1 | item),
  data = rt_data_small,
  family = gaussian(),
  prior = weak_priors,
  iter = 2000,
  warmup = 1000,
  chains = 4,
  cores = 4,
  seed = 123,
  backend = "cmdstanr",
  silent = 2,
  refresh = 0
)

11.2 Trace Plots: Poor Convergence

Show code
# Extract posterior
posterior_bad <- as_draws_array(rt_model_bad)

# Plot traces
mcmc_trace(
  posterior_bad,
  pars = c("b_Intercept", "b_conditionB", "b_conditionC",
           "sd_subject__Intercept", "sigma"),
  facet_args = list(ncol = 1)
) +
  labs(title = "Trace Plots: Poorly Converged Model",
       subtitle = "Notice poor mixing, different chain behaviors")

Warning Signs in These Traces

Look for: - ❌ Chains exploring different regions (not overlapping) - ❌ Slow mixing (snake-like patterns) - ❌ One or more chains “stuck” at different values - ❌ Trends over time (non-stationarity)

11.3 Check R-hat and ESS

Show code
# R-hat
rhat_bad <- rhat(rt_model_bad)
cat("=== R-HAT (BAD MODEL) ===\n")
=== R-HAT (BAD MODEL) ===
Show code
cat("Max R-hat:", round(max(rhat_bad, na.rm = TRUE), 4), "\n")
Max R-hat: 1.0062 
Show code
cat("Parameters with R-hat > 1.01:", sum(rhat_bad > 1.01, na.rm = TRUE), "\n\n")
Parameters with R-hat > 1.01: 0 
Show code
# Show worst parameters
cat("Parameters with highest R-hat:\n")
Parameters with highest R-hat:
Show code
sort(rhat_bad, decreasing = TRUE)[1:10] %>% round(4) %>% print()
r_subject[1,Intercept]            b_Intercept              Intercept 
                1.0062                 1.0059                 1.0056 
r_subject[3,Intercept] r_subject[8,Intercept] r_subject[7,Intercept] 
                1.0051                 1.0050                 1.0042 
r_subject[4,Intercept] r_subject[6,Intercept]                   lp__ 
                1.0040                 1.0040                 1.0036 
r_subject[2,Intercept] 
                1.0035 
Show code
# ESS
ess_bulk_bad <- ess_bulk(rt_model_bad)
ess_tail_bad <- ess_tail(rt_model_bad)

cat("\n=== ESS (BAD MODEL) ===\n")

=== ESS (BAD MODEL) ===
Show code
cat("Min ESS Bulk:", round(min(ess_bulk_bad, na.rm = TRUE), 0), "\n")
Min ESS Bulk: 62 
Show code
cat("Min ESS Tail:", round(min(ess_tail_bad, na.rm = TRUE), 0), "\n")
Min ESS Tail: Inf 
Show code
cat("Parameters with ESS < 400:", 
    sum(ess_bulk_bad < 400 | ess_tail_bad < 400, na.rm = TRUE), "\n")
Parameters with ESS < 400: 1 

11.4 What Went Wrong?

Show code
cat("=== DIAGNOSIS ===\n\n")
=== DIAGNOSIS ===
Show code
cat("1. Insufficient Data:\n")
1. Insufficient Data:
Show code
cat("   - Only", nrow(rt_data_small), "observations\n")
   - Only 240 observations
Show code
cat("   - Trying to estimate", length(rhat_bad), "parameters\n")
   - Trying to estimate 48 parameters
Show code
cat("   - Ratio:", round(nrow(rt_data_small) / length(rhat_bad), 1), 
    "observations per parameter\n")
   - Ratio: 5 observations per parameter
Show code
cat("   → PROBLEM: Not enough data to estimate all random effects precisely\n\n")
   → PROBLEM: Not enough data to estimate all random effects precisely
Show code
cat("2. Weak Priors:\n")
2. Weak Priors:
Show code
cat("   - Very vague priors don't constrain parameter space\n")
   - Very vague priors don't constrain parameter space
Show code
cat("   - With limited data, posterior poorly defined\n")
   - With limited data, posterior poorly defined
Show code
cat("   → SOLUTION: Use stronger, more informative priors\n\n")
   → SOLUTION: Use stronger, more informative priors
Show code
cat("3. Complex Model Structure:\n")
3. Complex Model Structure:
Show code
cat("   - Random slopes for 2 conditions + correlations\n")
   - Random slopes for 2 conditions + correlations
Show code
cat("   - Many variance components with little data\n")
   - Many variance components with little data
Show code
cat("   → SOLUTION: Simplify to random intercepts only\n")
   → SOLUTION: Simplify to random intercepts only

11.5 Test: Double Iterations on Bad Model

Let’s see what happens when we double iterations on the poorly converged model:

Show code
# Fit bad model with doubled iterations
rt_model_bad_doubled <- brm(
  log_rt ~ condition + (1 + condition | subject) + (1 | item),
  data = rt_data_small,
  family = gaussian(),
  prior = weak_priors,
  iter = 4000,      # Doubled from 2000
  warmup = 2000,
  chains = 4,
  cores = 4,
  seed = 123,
  backend = "cmdstanr",
  silent = 2,
  refresh = 0
)
Show code
# Compare bad model original vs doubled
fixef_bad_original <- fixef(rt_model_bad)
fixef_bad_doubled <- fixef(rt_model_bad_doubled)

comparison_bad <- data.frame(
  Parameter = rownames(fixef_bad_original),
  Original_Est = fixef_bad_original[, "Estimate"],
  Doubled_Est = fixef_bad_doubled[, "Estimate"],
  Original_SE = fixef_bad_original[, "Est.Error"],
  Doubled_SE = fixef_bad_doubled[, "Est.Error"]
) %>%
  mutate(
    Est_Diff = Doubled_Est - Original_Est,
    Est_Diff_Pct = abs(Est_Diff / Original_Est) * 100,
    SE_Ratio = Doubled_SE / Original_SE
  )

cat("\n=== BAD MODEL: STABILITY ASSESSMENT ===\n")

=== BAD MODEL: STABILITY ASSESSMENT ===
Show code
print(comparison_bad)
            Parameter Original_Est Doubled_Est Original_SE Doubled_SE
Intercept   Intercept    5.9748176   5.9733090  0.11456063 0.11241800
conditionB conditionB    0.1313419   0.1299990  0.05751411 0.05455722
conditionC conditionC    0.2342640   0.2321079  0.09600195 0.09238752
               Est_Diff Est_Diff_Pct  SE_Ratio
Intercept  -0.001508573   0.02524885 0.9812970
conditionB -0.001342911   1.02245400 0.9485884
conditionC -0.002156060   0.92035509 0.9623504
Show code
cat("\nMax absolute difference:", round(max(abs(comparison_bad$Est_Diff)), 4), "\n")

Max absolute difference: 0.0022 
Show code
cat("Max percentage change:", round(max(comparison_bad$Est_Diff_Pct), 2), "%\n")
Max percentage change: 1.02 %
Show code
cat("\n⚠️ Notice large percentage changes - model has NOT fully converged!\n")

⚠️ Notice large percentage changes - model has NOT fully converged!

11.6 Visual Comparison: Good vs Bad Model

Now let’s compare how the good (converged) and bad (non-converged) models behave when we double iterations:

Show code
# Prepare data for both models
plot_data_good <- comparison %>%
  select(Parameter, Original_Est, Doubled_Est) %>%
  pivot_longer(cols = c(Original_Est, Doubled_Est),
               names_to = "Iterations", values_to = "Estimate") %>%
  mutate(Iterations = recode(Iterations, 
                        Original_Est = "Original (2000)",
                        Doubled_Est = "Doubled (4000)"),
         Model_Type = "Good Model (Converged)")

plot_data_bad <- comparison_bad %>%
  select(Parameter, Original_Est, Doubled_Est) %>%
  pivot_longer(cols = c(Original_Est, Doubled_Est),
               names_to = "Iterations", values_to = "Estimate") %>%
  mutate(Iterations = recode(Iterations, 
                        Original_Est = "Original (2000)",
                        Doubled_Est = "Doubled (4000)"),
         Model_Type = "Bad Model (Not Converged)")

plot_data_combined <- bind_rows(plot_data_good, plot_data_bad)

# Plot comparison
ggplot(plot_data_combined, aes(x = Parameter, y = Estimate, color = Iterations)) +
  geom_point(size = 3, position = position_dodge(width = 0.4)) +
  geom_line(aes(group = Parameter), color = "gray50", alpha = 0.5) +
  geom_hline(yintercept = 0, linetype = "dashed") +
  facet_wrap(~ Model_Type, scales = "free_y", ncol = 1) +
  labs(title = "Parameter Stability: Good vs Bad Convergence",
       subtitle = "Top: Stable estimates | Bottom: Estimates drift with more iterations",
       x = NULL, y = "Estimate") +
  theme_minimal() +
  theme(axis.text.x = element_text(angle = 45, hjust = 1),
        legend.position = "top")

11.7 Credible Intervals: Good vs Bad Model

Show code
# Extract CIs for good model
ci_good_original <- as.data.frame(fixef_original) %>%
  rownames_to_column("Parameter") %>%
  mutate(Iterations = "Original (2000)", Model_Type = "Good Model (Converged)")

ci_good_doubled <- as.data.frame(fixef_doubled) %>%
  rownames_to_column("Parameter") %>%
  mutate(Iterations = "Doubled (4000)", Model_Type = "Good Model (Converged)")

# Extract CIs for bad model
ci_bad_original <- as.data.frame(fixef_bad_original) %>%
  rownames_to_column("Parameter") %>%
  mutate(Iterations = "Original (2000)", Model_Type = "Bad Model (Not Converged)")

ci_bad_doubled <- as.data.frame(fixef_bad_doubled) %>%
  rownames_to_column("Parameter") %>%
  mutate(Iterations = "Doubled (4000)", Model_Type = "Bad Model (Not Converged)")

ci_all <- bind_rows(ci_good_original, ci_good_doubled, ci_bad_original, ci_bad_doubled)

# Plot
ggplot(ci_all, aes(x = Parameter, y = Estimate, color = Iterations)) +
  geom_pointrange(aes(ymin = Q2.5, ymax = Q97.5),
                  position = position_dodge(width = 0.5),
                  size = 0.8, linewidth = 1) +
  geom_hline(yintercept = 0, linetype = "dashed") +
  facet_wrap(~ Model_Type, scales = "free", ncol = 1) +
  labs(title = "Credible Interval Stability: Good vs Bad Convergence",
       subtitle = "Top: CIs overlap completely | Bottom: CIs shift with more iterations",
       x = NULL, y = "Estimate (with 95% CI)") +
  theme_minimal() +
  theme(axis.text.x = element_text(angle = 45, hjust = 1),
        legend.position = "top")

Key Takeaway from Comparison

Good model (top panels): - Estimates barely change when doubling iterations - Credible intervals overlap almost completely - ✅ Indicates chains have converged

Bad model (bottom panels): - Estimates shift substantially with more iterations - Credible intervals move to different locations - ❌ Indicates chains have NOT converged - need to fix the underlying issues

Lesson: Doubling iterations alone won’t fix a fundamentally problematic model. Address root causes (data, priors, model structure) first.

Fixing Convergence Problems

Common causes and solutions:

  1. Insufficient data
    • Simplify model (remove random slopes, interactions)
    • Use stronger priors to regularize
    • Collect more data
  2. Weak/improper priors
    • Use informative priors based on domain knowledge
    • Check prior predictive distributions
    • Avoid completely flat priors
  3. Model misspecification
    • Check data coding (units, factors, centering)
    • Verify distributional assumptions (family)
    • Consider transformations (log, logit, etc.)
  4. Sampler struggles (divergent transitions)
    • Increase adapt_delta (e.g., 0.95 or 0.99)
    • Reparameterize (non-centered random effects)
    • Increase max_treedepth
  5. Just needs more time
    • Double or quadruple iterations
    • Increase warmup period
    • Run longer chains (but check other issues first!)

12 Summary: Complete Convergence Checklist

12.1 Step-by-Step Workflow

After fitting any Bayesian model, work through this checklist:

12.1.1 ✅ 1. Automatic Warnings

# brms automatically prints warnings
summary(model)

Look for: - ❌ “The largest R-hat is…” - ❌ “Bulk/Tail ESS is too low…” - ❌ “There were X divergent transitions…” - ❌ “Rhat > 1.01 for…”

12.1.2 ✅ 2. Trace Plots

plot(model, variable = c("b_", "sd_"), regex = TRUE)
# Or with bayesplot:
mcmc_trace(as_draws_array(model), pars = c("b_Intercept", ...))

Check: - Do all chains overlap completely? - No drift or trends over time? - “Hairy caterpillar” appearance?

12.1.3 ✅ 3. R-hat < 1.01

max(rhat(model))
# Should be < 1.01 for ALL parameters

12.1.4 ✅ 4. ESS > 400

min(ess_bulk(model))
min(ess_tail(model))
# Both should be > 400 for ALL parameters

12.1.5 ✅ 5. Low Autocorrelation

mcmc_acf(as_draws_array(model), pars = c(...))
# Should drop to near 0 by lag 10-20

12.1.6 ✅ 6. Substantive Sense

summary(model)
fixef(model)
ranef(model)

Ask: - Are parameter values in reasonable ranges? - Do effect signs match expectations? - Are magnitudes plausible?

12.1.7 ✅ 7. Stability Test (Optional)

# Refit with doubled iterations
model_doubled <- update(model, iter = 4000, warmup = 2000)
# Compare estimates - should be < 5% difference

12.2 Decision Matrix

Check Status Action
Warnings None ✅ Proceed
Warnings Divergent transitions Increase adapt_delta = 0.95+
Warnings Max treedepth Increase max_treedepth = 12+
Trace plots Well mixed ✅ Proceed
Trace plots Poor mixing Increase iterations, check model
R-hat All < 1.01 ✅ Proceed
R-hat Any > 1.01 ❌ Don’t trust results! Increase iterations
ESS All > 400 ✅ Proceed
ESS Any < 400 Increase iterations proportionally
Autocorrelation Drops quickly ✅ Proceed
Autocorrelation Stays high Increase iterations or reparameterize
Substantive Makes sense ✅ Proceed
Substantive Implausible Check model specification and data
Doubled iterations < 5% change ✅ Stable, proceed
Doubled iterations > 10% change ❌ Not converged, use more iterations

12.3 Quick Reference: Fixing Common Problems

12.3.1 Problem: High R-hat, low ESS

# Solution 1: More iterations
model <- brm(..., iter = 4000, warmup = 2000)

# Solution 2: Check for divergent transitions
# If yes, increase adapt_delta
model <- brm(..., control = list(adapt_delta = 0.95))

12.3.2 Problem: Divergent transitions

# Increase adapt_delta (makes sampler more careful)
model <- brm(..., control = list(adapt_delta = 0.95))

# If still divergent, try 0.99
model <- brm(..., control = list(adapt_delta = 0.99))

# Consider non-centered parameterization for random effects
# (Advanced: modify model formula or use custom Stan code)

12.3.3 Problem: Max treedepth warnings

# Increase max treedepth
model <- brm(..., control = list(max_treedepth = 12))

12.3.4 Problem: Implausible parameter values

# 1. Check data coding
summary(data)
str(data)

# 2. Use more informative priors
priors <- c(
  prior(normal(6, 1), class = Intercept),  # Stronger prior
  prior(normal(0, 0.5), class = b)          # More regularization
)

# 3. Simplify model
model <- brm(y ~ x + (1 | subject),  # Remove random slopes
             ...)

12.4 When Everything Looks Good

Once all checks pass:

You can trust your posterior estimates!

Proceed to: - ROPE analysis (Module 06) - Effect estimation with emmeans/marginaleffects (Module 06) - Bayes Factors (Module 07) - Report results in your manuscript

12.5 Final Thoughts

Convergence diagnostics are not optional!

  • Always check convergence before interpreting results
  • If in doubt, run longer chains
  • Document your diagnostics in supplementary materials
  • Make convergence checks part of your standard workflow

Remember: > “Garbage in, garbage out” applies to MCMC too. If your chains haven’t converged, your inferences are meaningless—no matter how sophisticated your analysis!

13 Exercises

13.1 Exercise 1: Check Your Own Model

Take a model you’ve fitted in previous modules:

  1. Run all convergence diagnostics
  2. Create a trace plot for key parameters
  3. Check R-hat and ESS values
  4. Verify parameters make substantive sense
  5. Document your findings

13.2 Exercise 2: Fix a Convergence Problem

Use the poorly converged model from this module:

  1. Identify the specific problems
  2. Propose 2-3 solutions
  3. Implement one solution and recheck diagnostics
  4. Compare results before/after

13.3 Exercise 3: Sensitivity to Iterations

Fit the same model with different iteration settings: - 1000 iterations (500 warmup) - 2000 iterations (1000 warmup) - 4000 iterations (2000 warmup)

Compare: - Parameter estimates - Credible interval widths - ESS values - Computation time

When do estimates stabilize?

14 Literature and Resources

14.1 Essential Reading

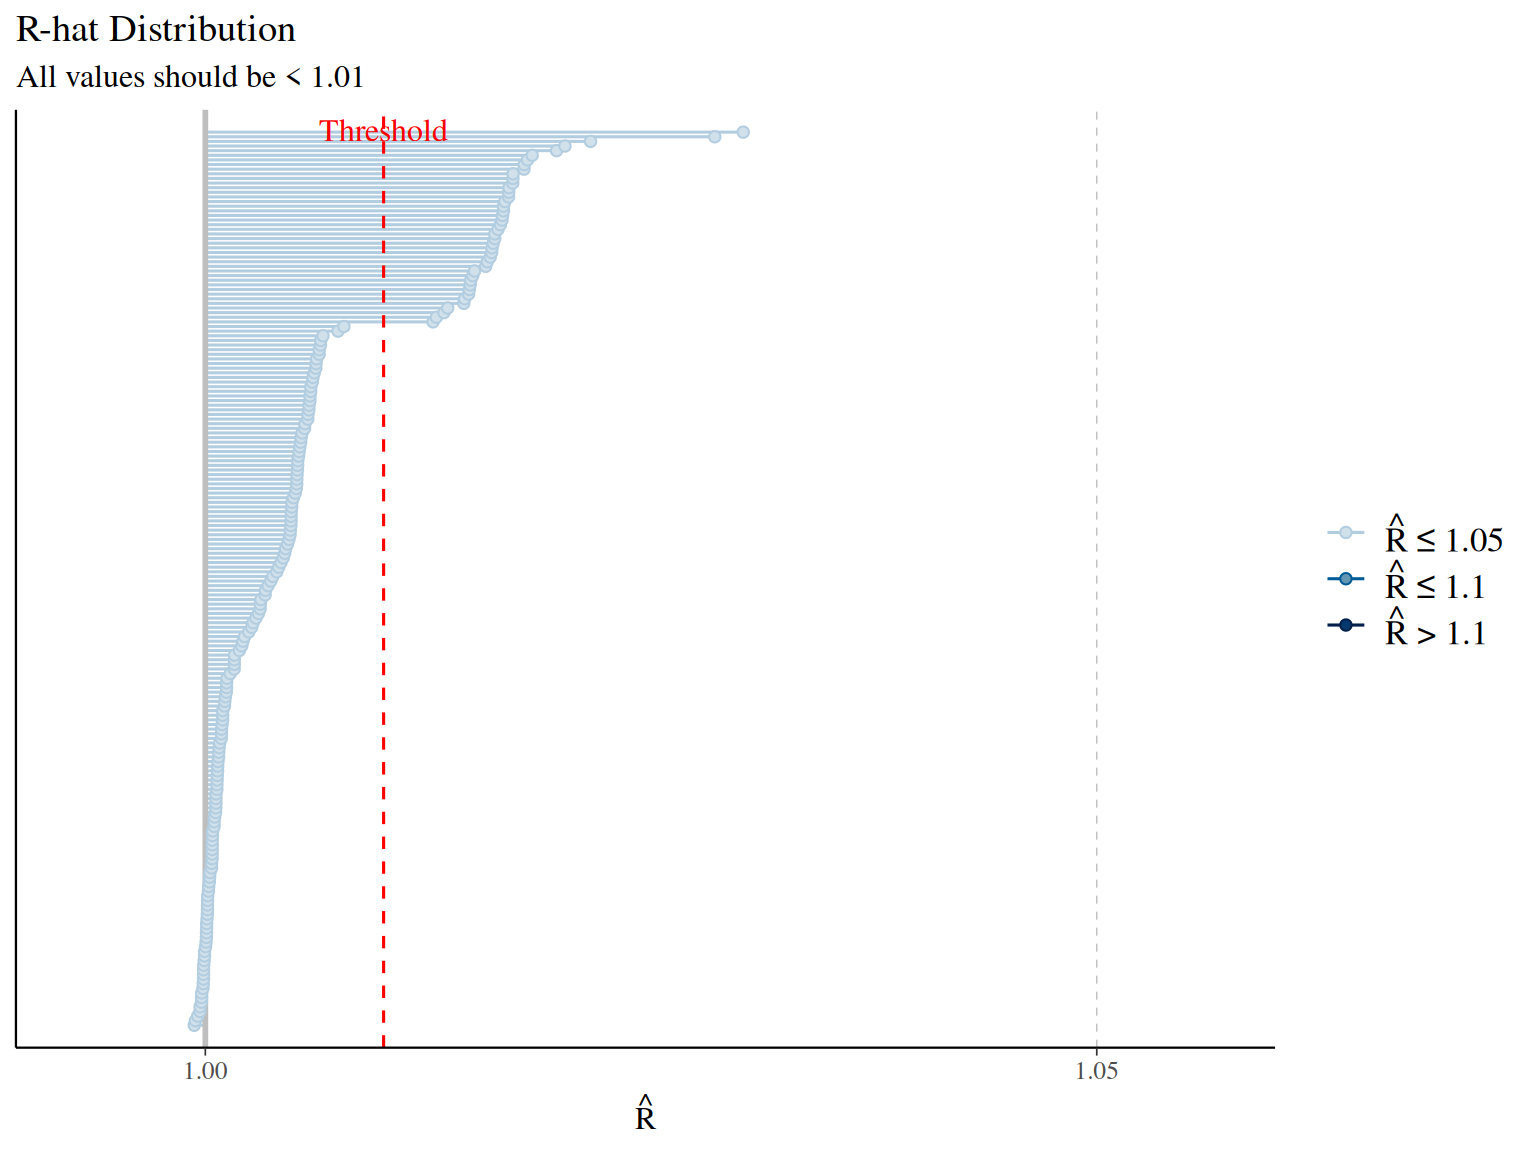
Convergence diagnostics: - Vehtari, A., Gelman, A., Simpson, D., Carpenter, B., & Bürkner, P. C. (2021). Rank-normalization, folding, and localization: An improved R̂ for assessing convergence of MCMC. Bayesian Analysis, 16(2), 667-718. - Modern R-hat diagnostic (current standard)

  • Gelman, A., & Rubin, D. B. (1992). Inference from iterative simulation using multiple sequences. Statistical Science, 7(4), 457-472.
    • Original R-hat diagnostic

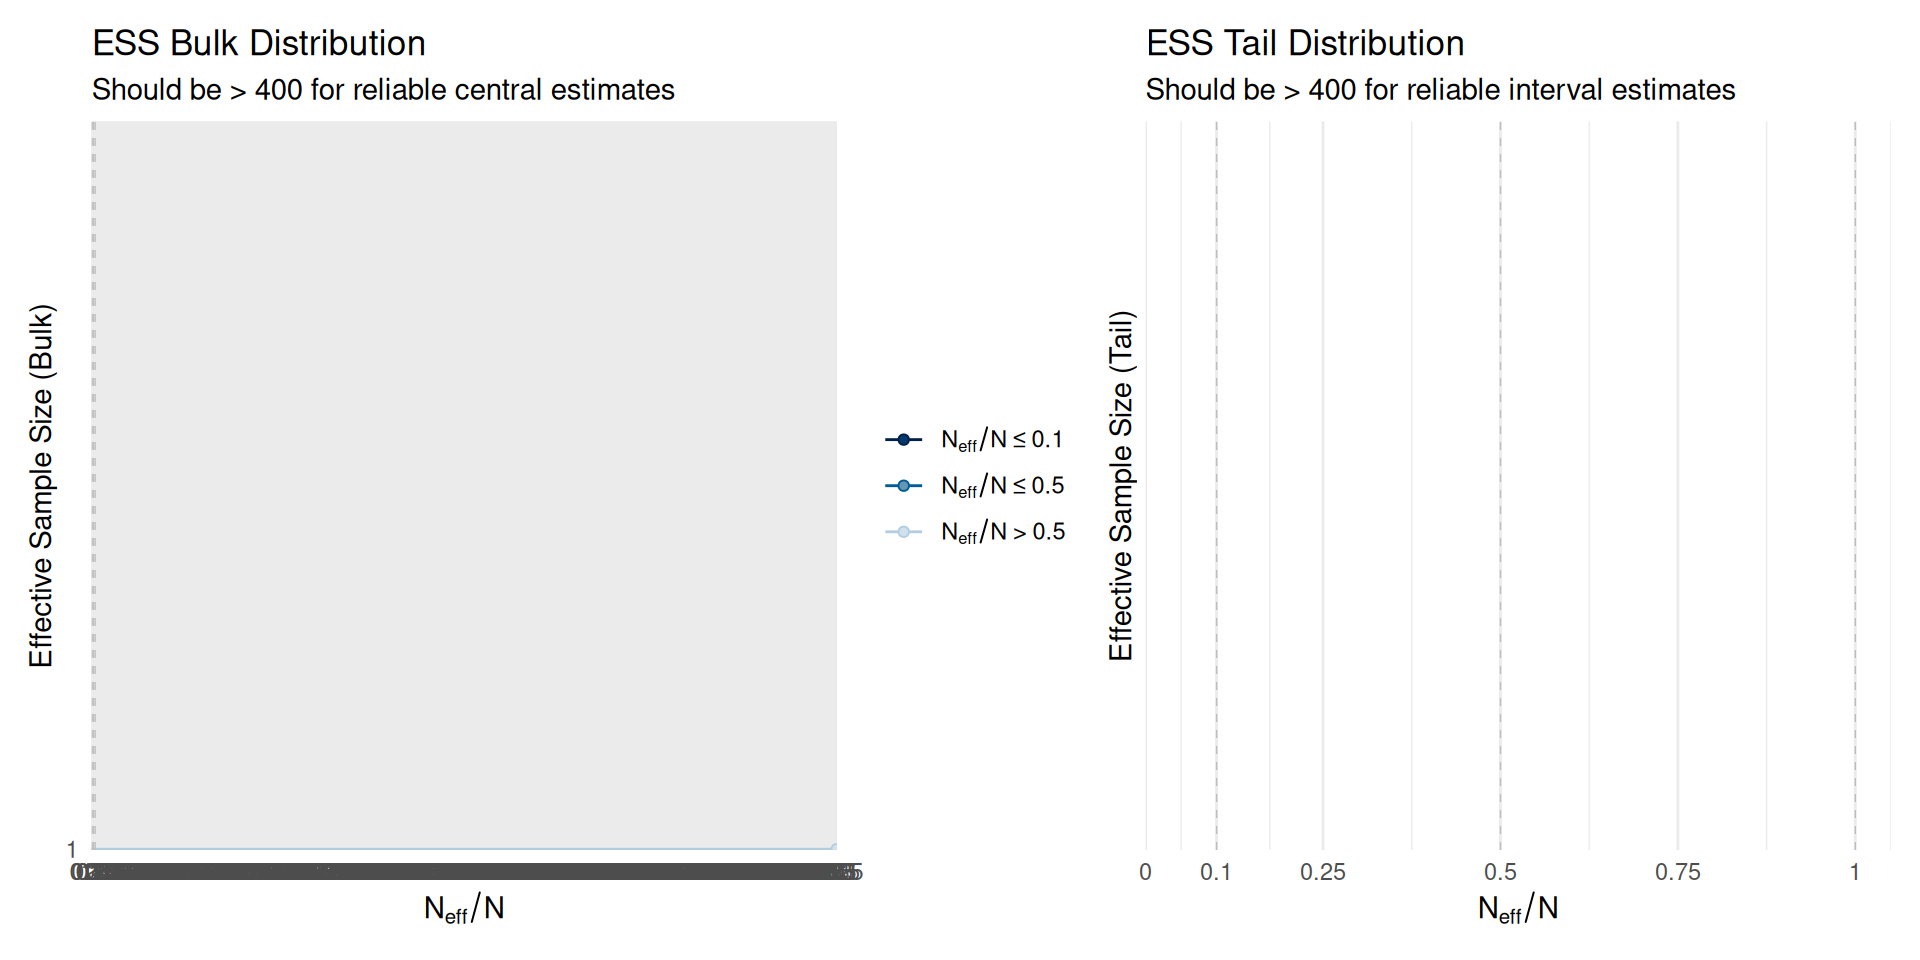
Effective sample size: - Vehtari et al. (2021) [same as above] - ESS bulk and tail diagnostics

General MCMC diagnostics: - Gelman, A., Carlin, J. B., Stern, H. S., Dunson, D. B., Vehtari, A., & Rubin, D. B. (2013). Bayesian Data Analysis (3rd ed.). CRC Press. - Chapter 11: Basics of Markov Chain Simulation - Gold standard textbook

Practical guidance: - Gabry, J., Simpson, D., Vehtari, A., Betancourt, M., & Gelman, A. (2019). Visualization in Bayesian workflow. Journal of the Royal Statistical Society A, 182(2), 389-402. - Comprehensive workflow including convergence checks

14.2 Software Documentation

  • brms: help("brms-package"), especially MCMC settings
  • bayesplot: vignette("visual-mcmc-diagnostics")
  • posterior: vignette("posterior")
  • Stan: https://mc-stan.org/docs/reference-manual/

14.3 Advanced Topics

  • Non-centered parameterizations: Betancourt, M., & Girolami, M. (2015). Hamiltonian Monte Carlo for hierarchical models.
  • Divergent transitions: https://mc-stan.org/docs/2_27/reference-manual/divergent-transitions.html

Next Module: With converged models in hand, you’re ready to report your results!